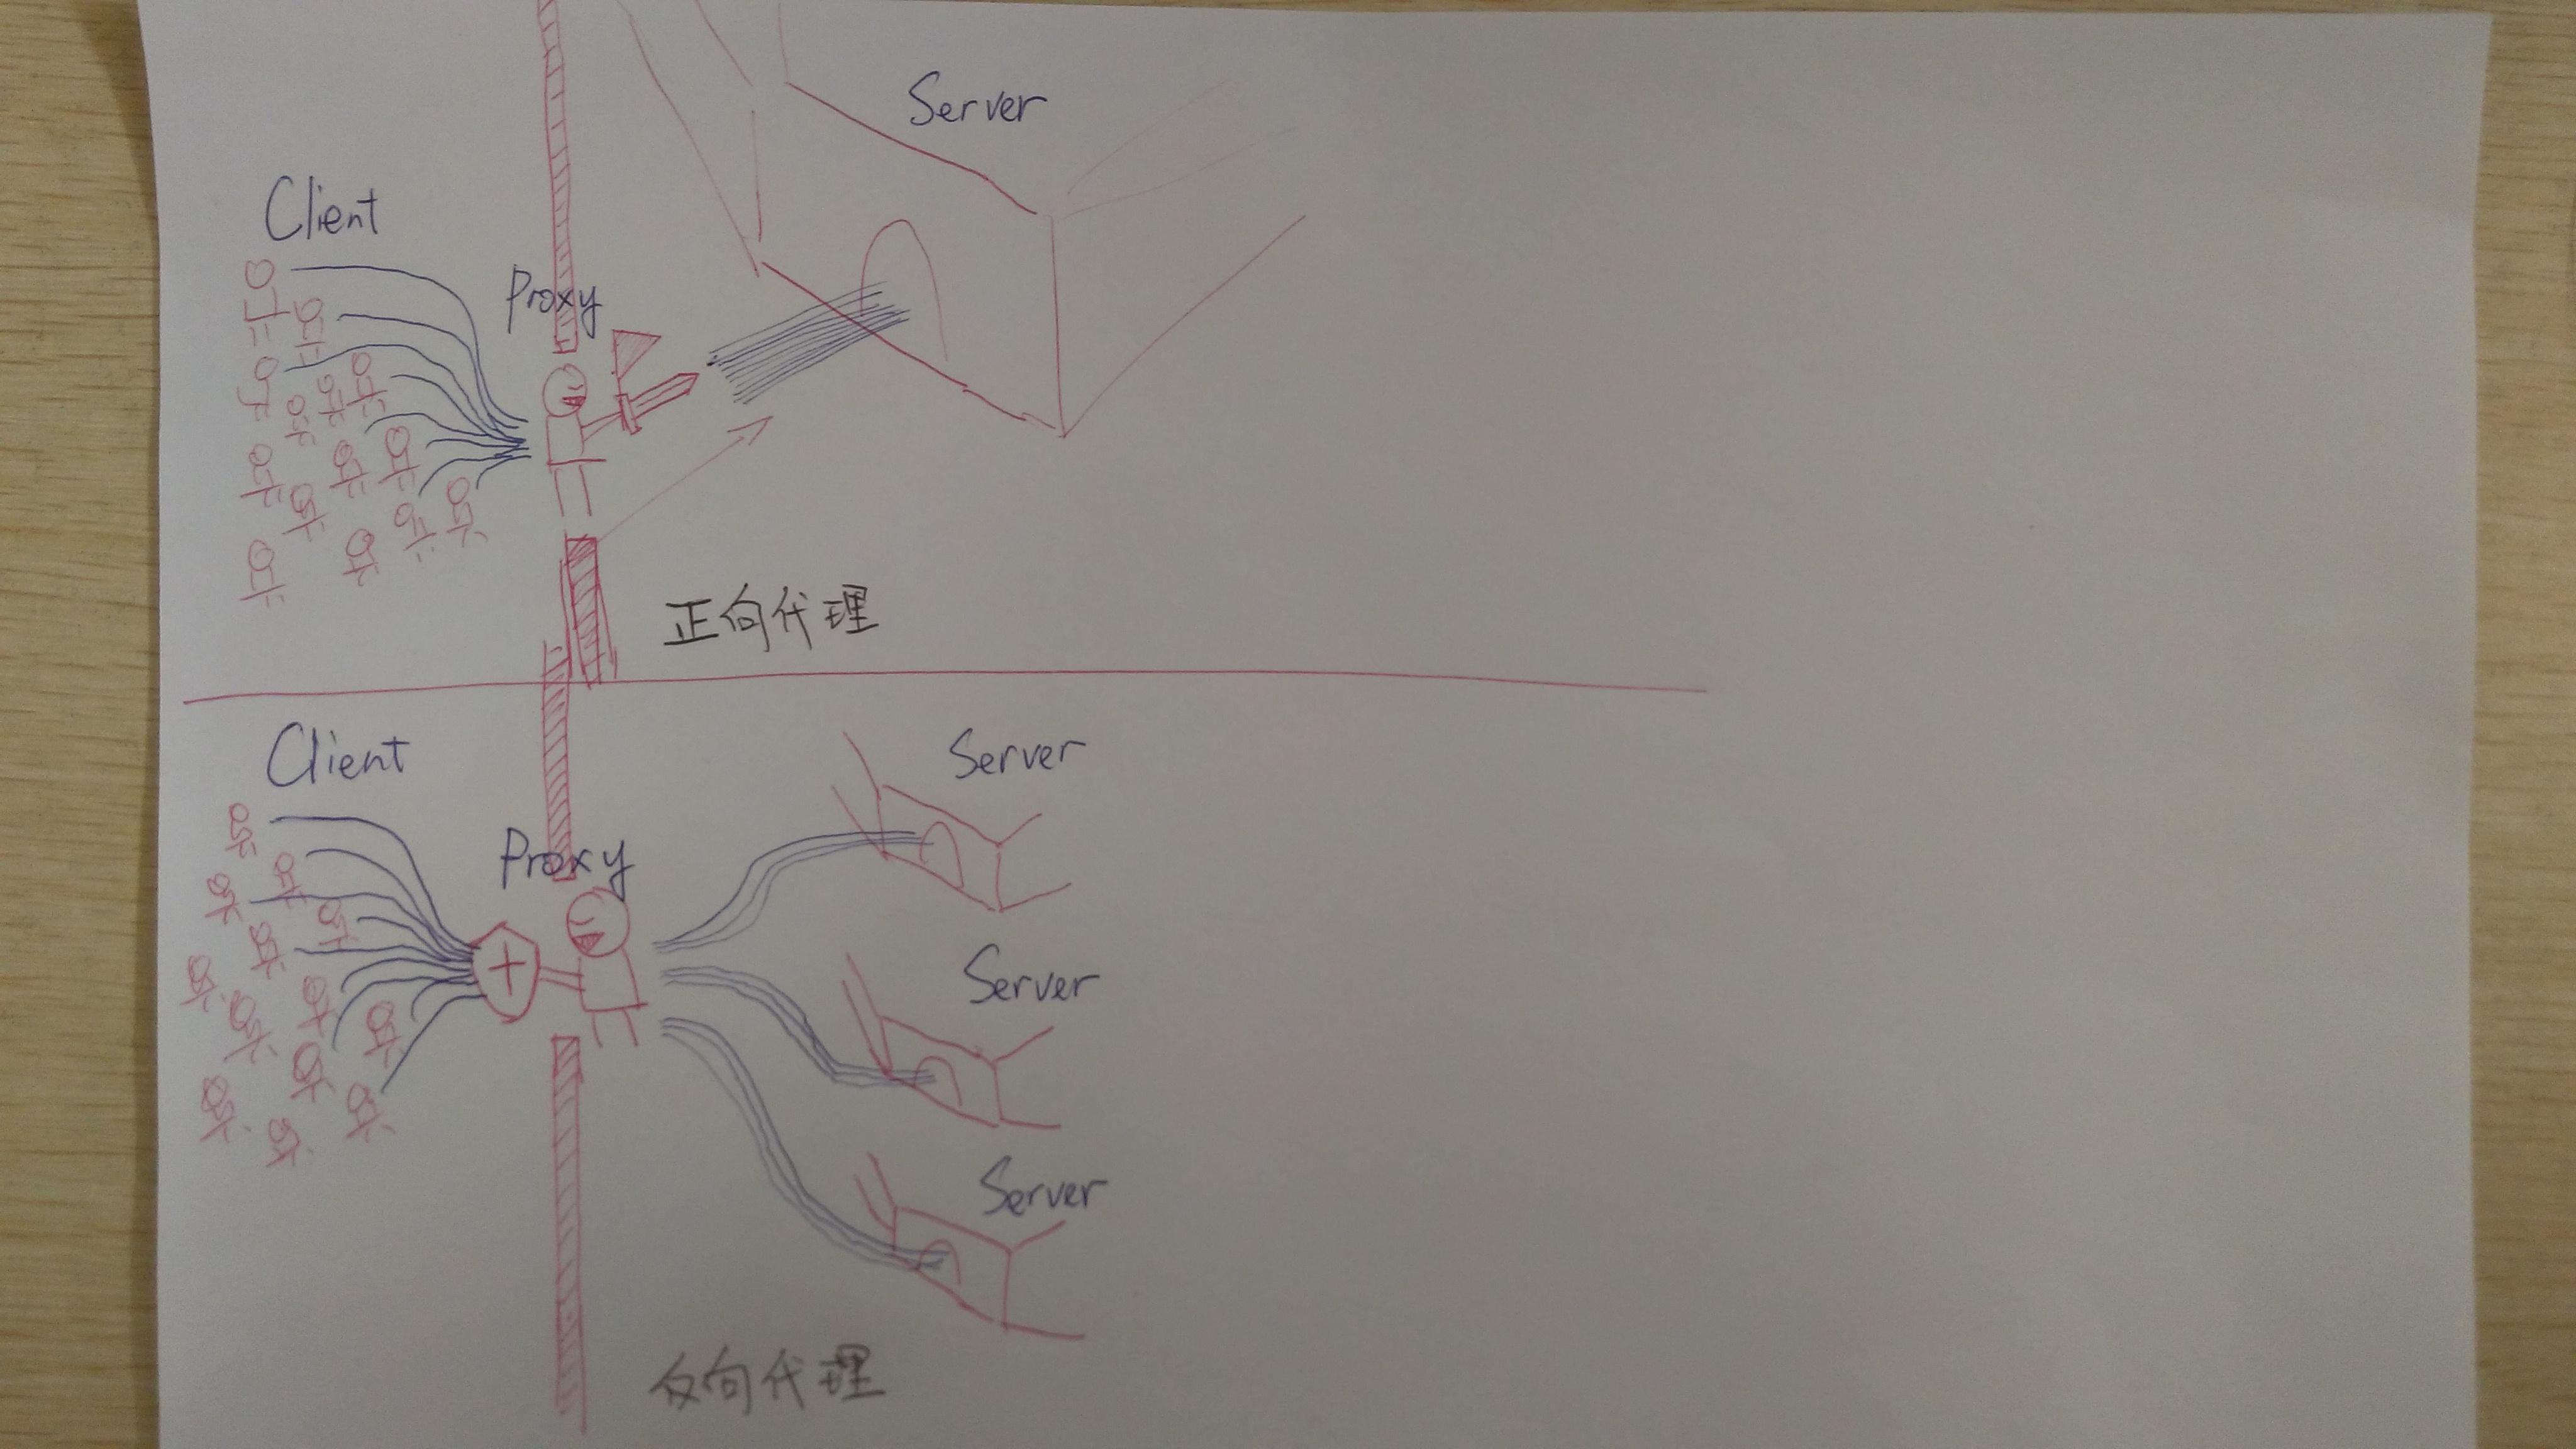
1
2
3
4
5
6
7
8
9
10
11
12
13
14
15
16
17
18
19
20
21
22
23
24
25
26
27
28
29
30
31
32
33
34
35
36
37
38
39
40
41
42
43
44
45
46
47
48
49
50
51
52
53
54
55
56
57
58
59
60
61
62
63
64
65
66
67
68
69
70
71
72
73
74
75
76
77
78
79
80
81
82
83
84
85
86
87
88
89
90
91
92
93
94
95
96
97
98
99
100
101
102
103
104
105
106
107
108
109
110
111
112
113
114
115
116
117
118
119
120
121
122
123
124
125
126
127
128
129
130
131
132
133
134
135
136
137
| var app = angular.module('demo', []);
angular.module('demo').controller("myCtrl", function($scope, $http, $interval) {
$interval(function() {
$http.get("/demo_get")
.success(function(data) {
if (data.status == '0') {
$scope.data = data.data;
}
}).error(function() {
$scope.data[0].value = Math.floor(Math.random() * 2000);
});
}, 3000);
$scope.data = [{
'value': 335,
'name': '直接访问'
}, {
'value': 310,
'name': '邮件营销'
}, {
'value': 234,
'name': '联盟广告'
}, {
'value': 135,
'name': '视频广告'
}, {
'value': 748,
'name': '搜索引擎'
}];
});
angular.module('demo').directive('barChart', function($window) {
return {
restrict: 'A',
link: function($scope, element, attrs) {
var myChart = echarts.init(element[0]);
$scope.$watch(attrs.eData, function(newValue, oldValue, scope) {
var xData = [],
sData = [],
data = newValue;
angular.forEach(data, function(val) {
xData.push(val.name);
sData.push(val.value);
});
var option = {
title: {
text: '某站点用户访问来源',
subtext: '纯属虚构',
x: 'center'
},
color: ['#3398DB'],
tooltip: {
trigger: 'axis',
axisPointer: {
type: 'shadow'
}
},
grid: {
left: '3%',
right: '4%',
bottom: '3%',
containLabel: true
},
xAxis: [{
type: 'category',
data: xData,
axisTick: {
alignWithLabel: true
}
}],
yAxis: [{
type: 'value'
}],
series: [{
name: '直接访问',
type: 'bar',
barWidth: '60%',
data: sData
}]
};
myChart.setOption(option);
}, true);
$window.onresize = function() {
myChart.resize();
};
}
};
});
angular.module('demo').directive('pieChart', function($window) {
return {
restrict: 'A',
link: function($scope, element, attrs) {
var myChart = echarts.init(element[0]);
$scope.$watch(attrs.eData, function(newValue, oldValue, scope) {
var legend = [];
angular.forEach(newValue, function(val) {
legend.push(val.name);
});
var option = {
title: {
text: '某站点用户访问来源',
subtext: '纯属虚构',
x: 'center'
},
tooltip: {
trigger: 'item',
formatter: "{a} <br/>{b} : {c} ({d}%)"
},
legend: {
orient: 'vertical',
left: 'left',
data: legend
},
series: [{
name: '访问来源',
type: 'pie',
radius: '55%',
center: ['50%', '60%'],
data: newValue,
itemStyle: {
emphasis: {
shadowBlur: 10,
shadowOffsetX: 0,
shadowColor: 'rgba(0, 0, 0, 0.5)'
}
}
}]
};
myChart.setOption(option);
}, true);
window.addEventListener("resize", function() {
myChart.resize();
});
}
};
});
|

